The area under the torque curve matters far more than peak horsepower. Horsepower is nice for pub arguments, but if you actually want your car to accelerate, it’s torque delivery across the rev range that does the heavy lifting.
The Basics: Torque, Power, and Acceleration
Torque is the twisting force the engine applies. Power is simply torque applied quickly. The two are related by the precise and slightly boring equation:
P = T × ω
Where P is power, T is torque, and ω is engine speed in radians per second. Yes, radians – we are not barbarians.
Acceleration at the wheel follows from:
F = M·a and T = r·F = r·M·a
This means the only thing separating you from an embarrassing 0–100 time is mass, gearing, and your choice at lunch (pie or salad).
Area Under the Torque Curve: From Calculus to Car Feel
Average power over a rev band (ω₁ to ω₂) is defined as:
Average Power = (1 / (ω₂ − ω₁)) · ∫ω₁ω₂ T(ω) · ω dω
This integral is the mathematical way of saying: “If the torque curve is fat, the car goes fast. If it is skinny, you should have bought your bicycle.”
Flat vs Rising Torque Curves
Engines with positive-displacement superchargers (Jaguar V6, Audi V8, etc.) deliver a nearly flat torque curve. That means instant shove from idle to redline – a very German approach: consistent, efficient, predictable.
Centrifugal superchargers and certain turbos, on the other hand, build torque with rpm. This gives the illusion of drama. Mathematically, however, drama is inefficient.
Assume torque rises linearly from T₁ at ω₁ to T₂ at ω₂. Then:
- Exact average power:
Pexact ∝ (T₂ − T₁)(ω₂ − ω₁) / ln(R), with R = T₂/T₁ - Approximation (area under curve):
Papprox ∝ (T₁ + T₂)/2 · (ω₂ − ω₁)
Difference: Close enough. Your stopwatch will not care, an engineer will raise an eyebrow.
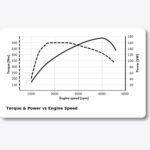
A Real-World Illustration
Two engines, both with 400 Nm peak:
- Engine A (flat): ~400 Nm from 2,000 to 6,000 rpm.
- Engine B (rising): ~150 Nm at 2,000 rpm, climbing to 400 Nm at 6,000 rpm.
Spec sheets say: “Both 400 Nm.” Reality says: Engine A accelerates everywhere. Engine B accelerates only when you are already late to your dentist appointment. This is why torque spread matters more than peak headlines.
The Takeaway
Peak horsepower figures are for marketing departments. The area under the torque curve is for engineers, drivers, and anyone who values getting to the next village before the bakery closes.
So remember: maximise torque across the rev range, not just at one photogenic peak. Your car and your pride will thank you.